Trading in the stock market requires more than just intuition; it requires a solid strategy grounded in reliable data. Technical analysis is one of the most powerful methods traders use to analyse market movements and make informed decisions. By studying historical price data and trading volumes, traders can predict future price movements and identify trading opportunities. In this blog, we will explore essential technical analysis tools that can help you become a successful trader.
Table of Contents
1. What is Technical Analysis?
Technical analysis is a method used to evaluate and predict the future price movements of securities based on historical price data and trading volume. Unlike fundamental analysis, which looks at a company’s financial health and economic factors, technical analysis focuses on patterns and indicators derived from price charts.
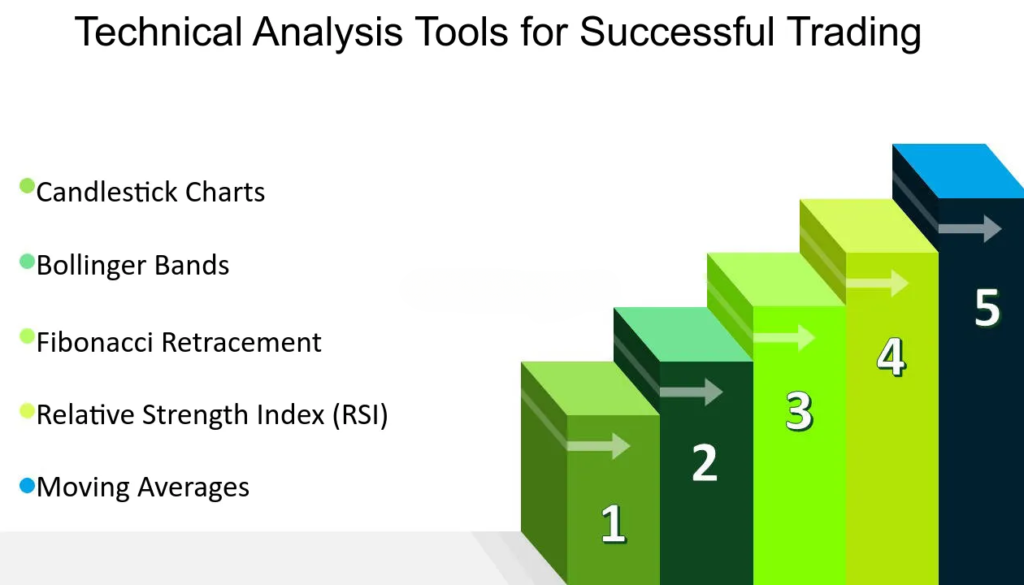
2. Key Technical Analysis Tools
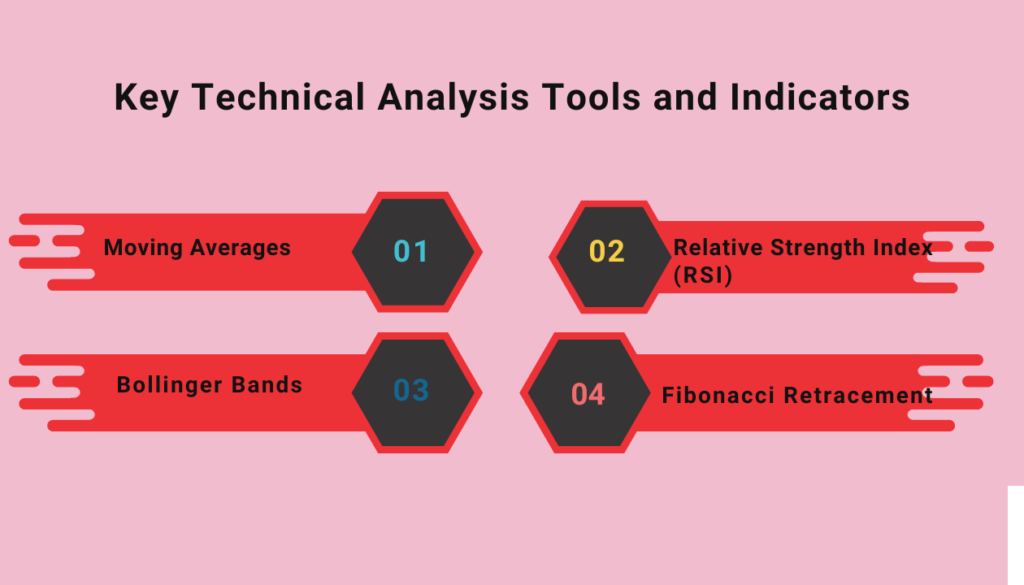
A. Moving Averages
Moving averages are one of the simplest and most popular technical analysis tools. They smooth out price data to create a single flowing line, making it easier to identify trends. There are different types of moving averages, including:
Simple Moving Average (SMA): The average price over a specific number of periods.
Exponential Moving Average (EMA): Gives more weight to recent prices, making it more responsive to new information.
B. Relative Strength Index (RSI)
The Relative Strength Index (RSI) is a momentum oscillator that measures the speed and change of price movements. It ranges from 0 to 100 and is typically used to identify overbought or oversold conditions in the market. An RSI above 70 indicates overbought conditions, while an RSI below 30 indicates oversold conditions.
C. Bollinger Bands
Bollinger Bands consist of three lines: a middle band (SMA), an upper band, and a lower band. The upper and lower bands are standard deviations away from the middle band. Bollinger Bands help traders understand market volatility and identify potential reversal points. When prices move closer to the upper band, the market is considered overbought; when they move closer to the lower band, it is considered oversold.
D. MACD (Moving Average Convergence Divergence)
The MACD is a trend-following momentum indicator that shows the relationship between two moving averages of a security’s price. It consists of the MACD line, the signal line, and the histogram. The MACD line is the difference between the 12-day EMA and the 26-day EMA. When the MACD line crosses above the signal line, it’s a bullish signal; when it crosses below, it’s a bearish signal.
E. Fibonacci Retracement
Fibonacci retracement levels are horizontal lines that indicate where support and resistance are likely to occur. These levels are based on the Fibonacci sequence and are used to predict potential reversal points. Common retracement levels include 23.6%, 38.2%, 50%, 61.8%, and 100%.
3. How to Use Technical Analysis Tools
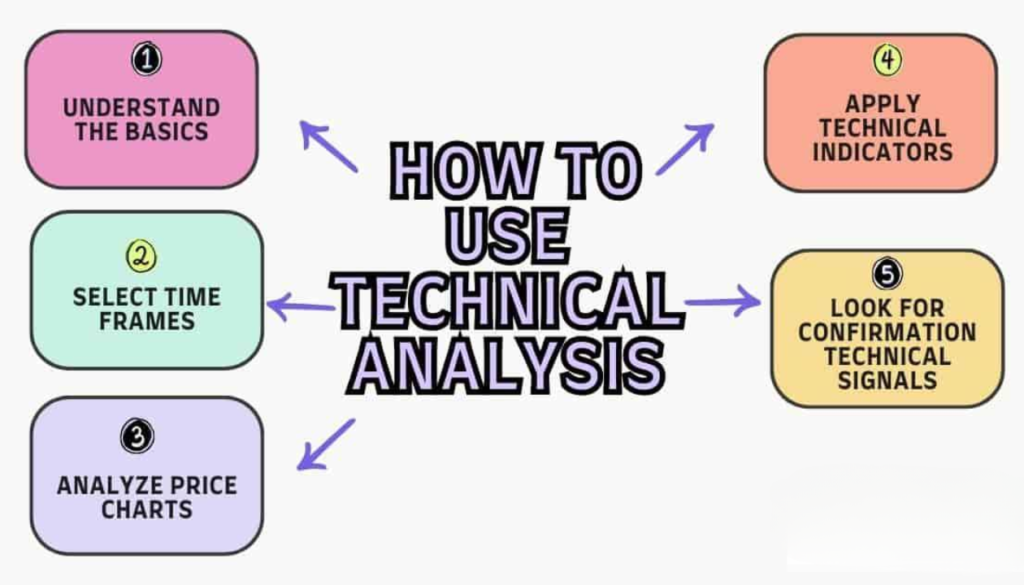
A. Identify Trends: Use moving averages and trendlines to identify the direction of the market. Understanding whether a market is in an uptrend, downtrend, or sideways trend is crucial for making trading decisions.
B. Analyze Momentum: Indicators like RSI and MACD help gauge the strength of a trend and identify potential reversal points. For instance, an overbought RSI may signal a potential price drop.
C. Determine Volatility: Bollinger Bands provide insights into market volatility. When the bands widen, volatility increases; when they contract, volatility decreases. This information can help you adjust your trading strategies accordingly.
D. Find Support and Resistance Levels: Fibonacci retracement levels and historical price data can help identify key support and resistance levels, which are critical for setting entry and exit points.
E. Combine Tools: No single technical analysis tool is foolproof. Combining multiple tools can provide a more comprehensive view of the market and improve the accuracy of your predictions.
4. Best Practices for Using Technical Analysis Tools
Keep it Simple: Avoid overloading your charts with too many indicators. Focus on a few key tools that you understand well.
A. Practice Patience: Technical analysis is not about quick wins. It requires patience and practice to interpret the data correctly and make informed decisions.
B. Stay Informed: Keep up with market news and events that can impact price movements. Technical analysis works best when complemented with an understanding of market fundamentals.
C. Test Your Strategies: Use demo accounts to test your trading strategies before applying them in live markets. This helps you refine your approach without risking real money.
D. Adapt and Learn: Markets are constantly changing. Stay flexible and be willing to adapt your strategies as you gain more experience and market conditions evolve.
Conclusion
Technical analysis tools are essential for successful trading, providing traders with the insights needed to make informed decisions. By understanding and utilising these tools, you can improve your trading strategies, manage risks, and enhance your overall trading performance. Remember, successful trading requires continuous learning, practice, and adaptation to changing market conditions. Start your journey with technical analysis today and unlock the potential for greater trading success.
Frequently Asked Questions
1. What are technical analysis tools in trading?
Ans. Technical analysis tools are instruments and indicators used to analyze historical price data and trading volumes to predict future price movements and identify trading opportunities.
2. How do technical indicators help in trading?
Ans. Technical indicators help traders understand market trends, momentum, volatility, and potential reversal points, allowing them to make more informed trading decisions.
3. What are the most important chart patterns to know?
Ans. Key chart patterns include head and shoulders, double tops and bottoms, triangles, and flags. These patterns help identify potential market reversals and continuation signals.
4. Can technical analysis tools predict market movements accurately?
Ans. While technical analysis tools provide valuable insights, they are not foolproof and cannot predict market movements with absolute certainty. They should be used in conjunction with other analysis methods and risk management strategies.
5. How can beginners start using technical analysis tools?
Ans. Beginners can start by learning the basics of key technical analysis tools and practicing with demo accounts. It’s essential to build a solid understanding before applying these tools in live trading.